Zhenyi Tsai
Ecological Geographer & GIS EngineerDisaster-response cartography, Gyirong–Nepal flood corridor
A live 3D terrain scene of the Bhote Koshi flood corridor
An interactive, self-hosted 3D scene of the Gyirong (སྐྱིད་གྲོང་རྫོང་།)–Nepal border corridor, built to map the 26 August 2026 Bhote Koshi flash flood in three dimensions. Drag to orbit, scroll to zoom, use WASD or the arrow keys to walk the corridor, and click any settlement for dated situation-report updates.
This project was designed to create an interactive, web-based situational map of the 26 August 2026 Bhote Koshi flash flood, documenting where the event originated, how it propagated through the Gyirong–Nepal corridor, and which communities were affected as conditions evolved. Rather than presenting a static map alone, the interface combines terrain context with live-style incident updates, making it easier to understand both the physical hazard and the human impact in a single, navigable environment.
The system is built as a lightweight GitHub Pages deployment: a single HTML page loads Three.js from a CDN and renders a height-mapped terrain model generated from a Copernicus DEM encoded as a Terrain-RGB PNG. Flood extent, damage buffers, the flood-origin marker, and settlement-based updates are structured as client-side geographic and narrative data, allowing the map to function as a disaster-tracking and reporting tool without requiring a backend or external map tiles. The repo documents the encoding workflow, data sources, and visual architecture so the project can be reused for other rapid-response or event-tracking scenarios.
Project 02 — Glacial hazard screening
Glacial lake outburst flood screening, Nepal's Koshi Basin
Mapping who lives in the path of a glacial flood
A screening model for glacial lake outburst floods across Nepal's Koshi Basin — narrowing two thousand lakes down to the settlements, and the people, who would be standing downstream.
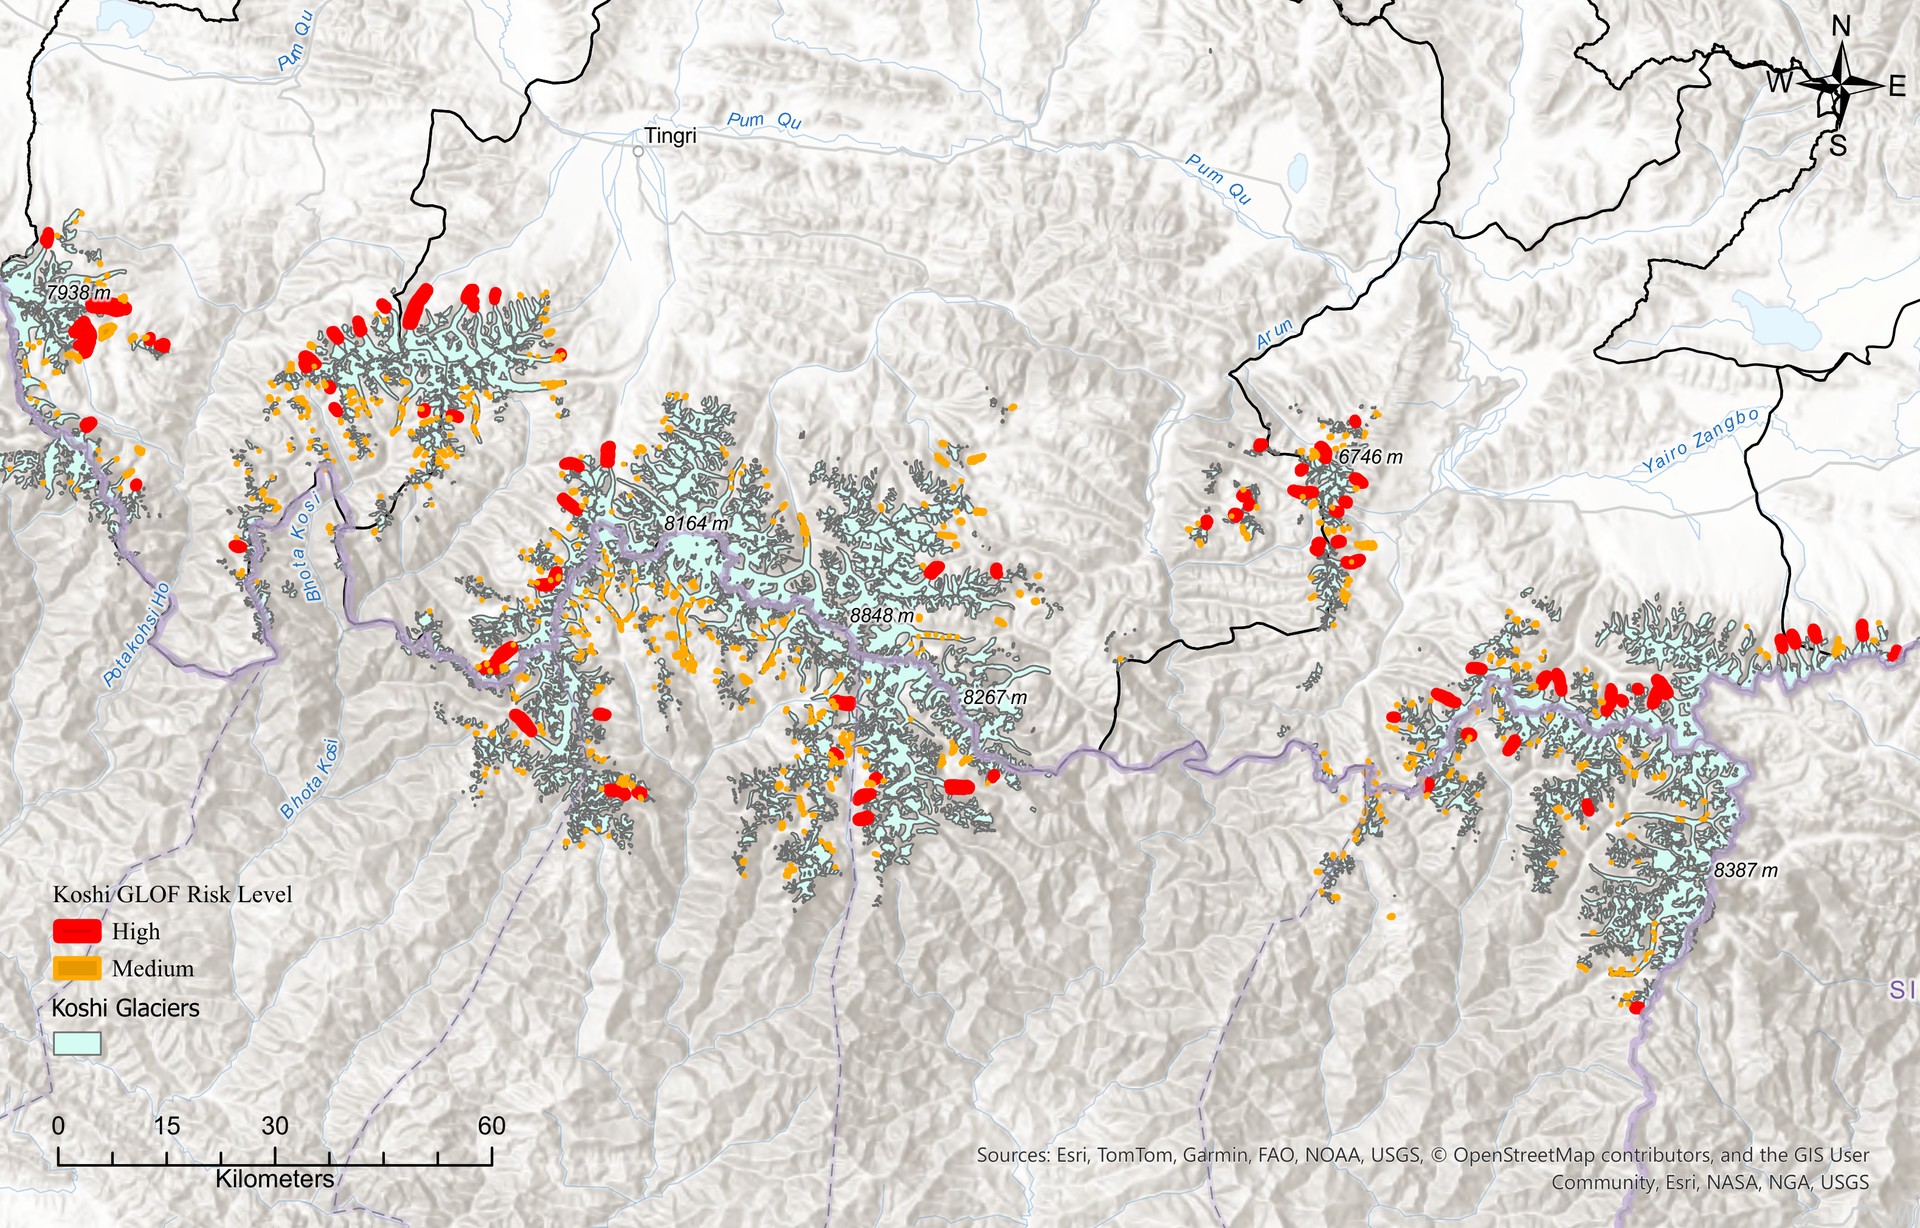
A glacial lake outburst flood begins where ice, meltwater, and a fragile natural dam meet. Across the Koshi Basin, roughly two thousand lakes sit in that arrangement — and only a handful will ever fail. The problem is not a shortage of lakes to worry about; it is knowing which ones, and who sits below them.
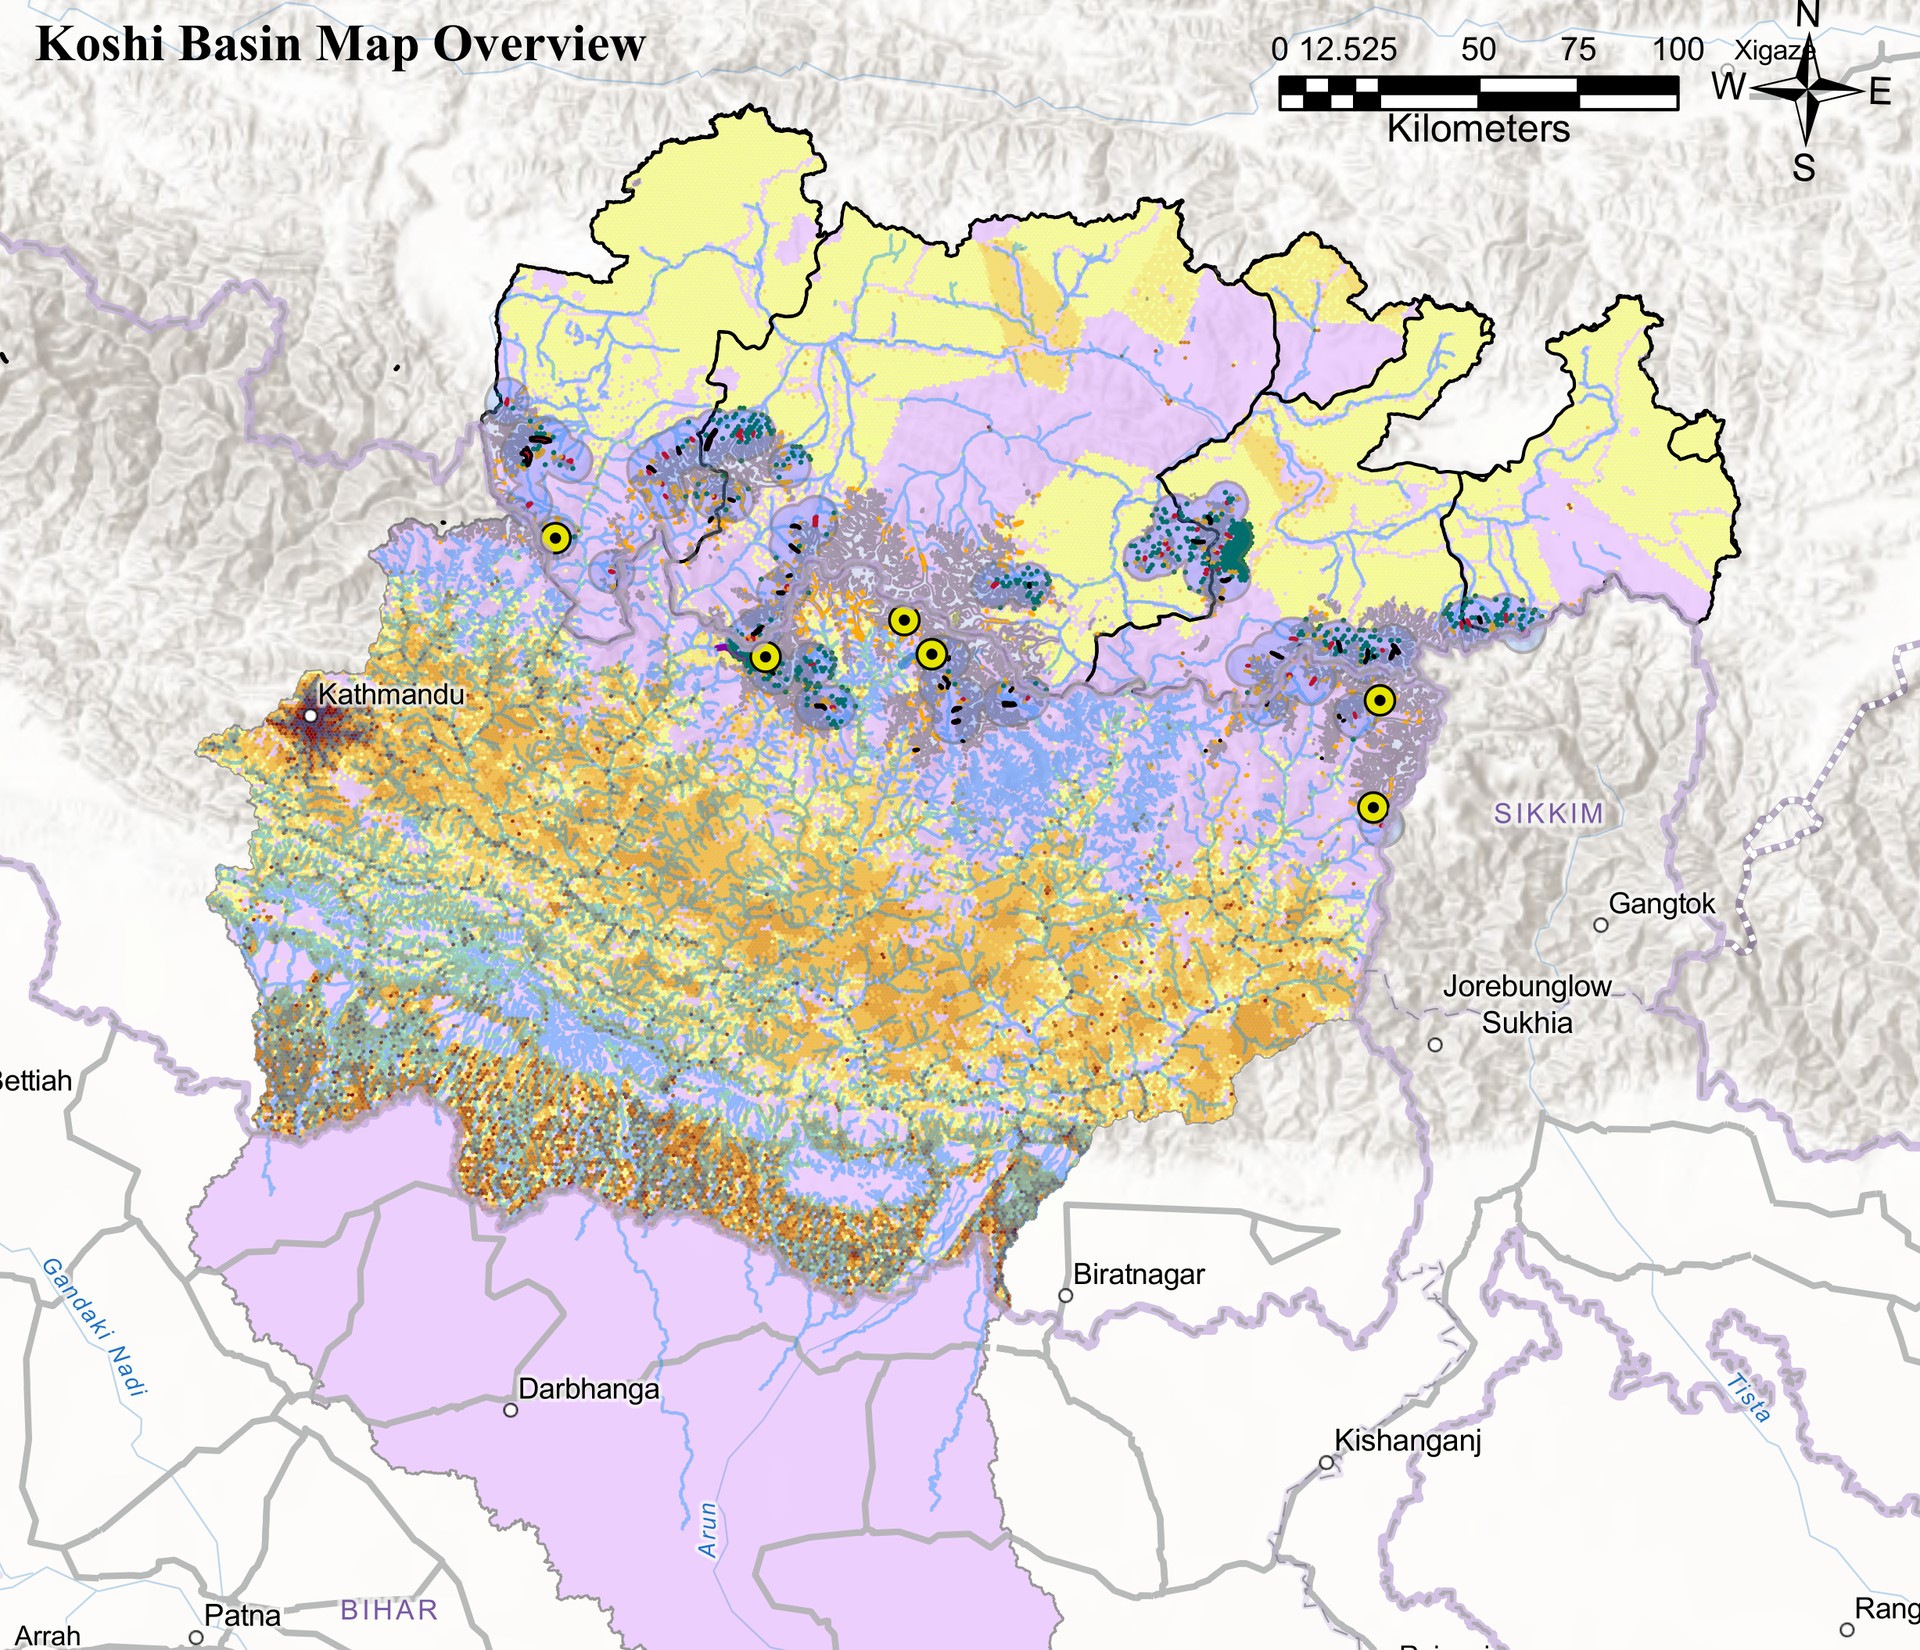
This project builds a lightweight, repeatable way to triage that question. Rather than model every lake in exhaustive detail, it scores all of them on the three variables that most reliably separate the dangerous from the benign, then carries the survivors through validation, proximity exposure, and downstream flood-path analysis — the same path a hazard analyst would walk, made legible on a map.
A basin of extremes, from Everest to the plains
Does the model hold up?
Checking a fast model against a careful one
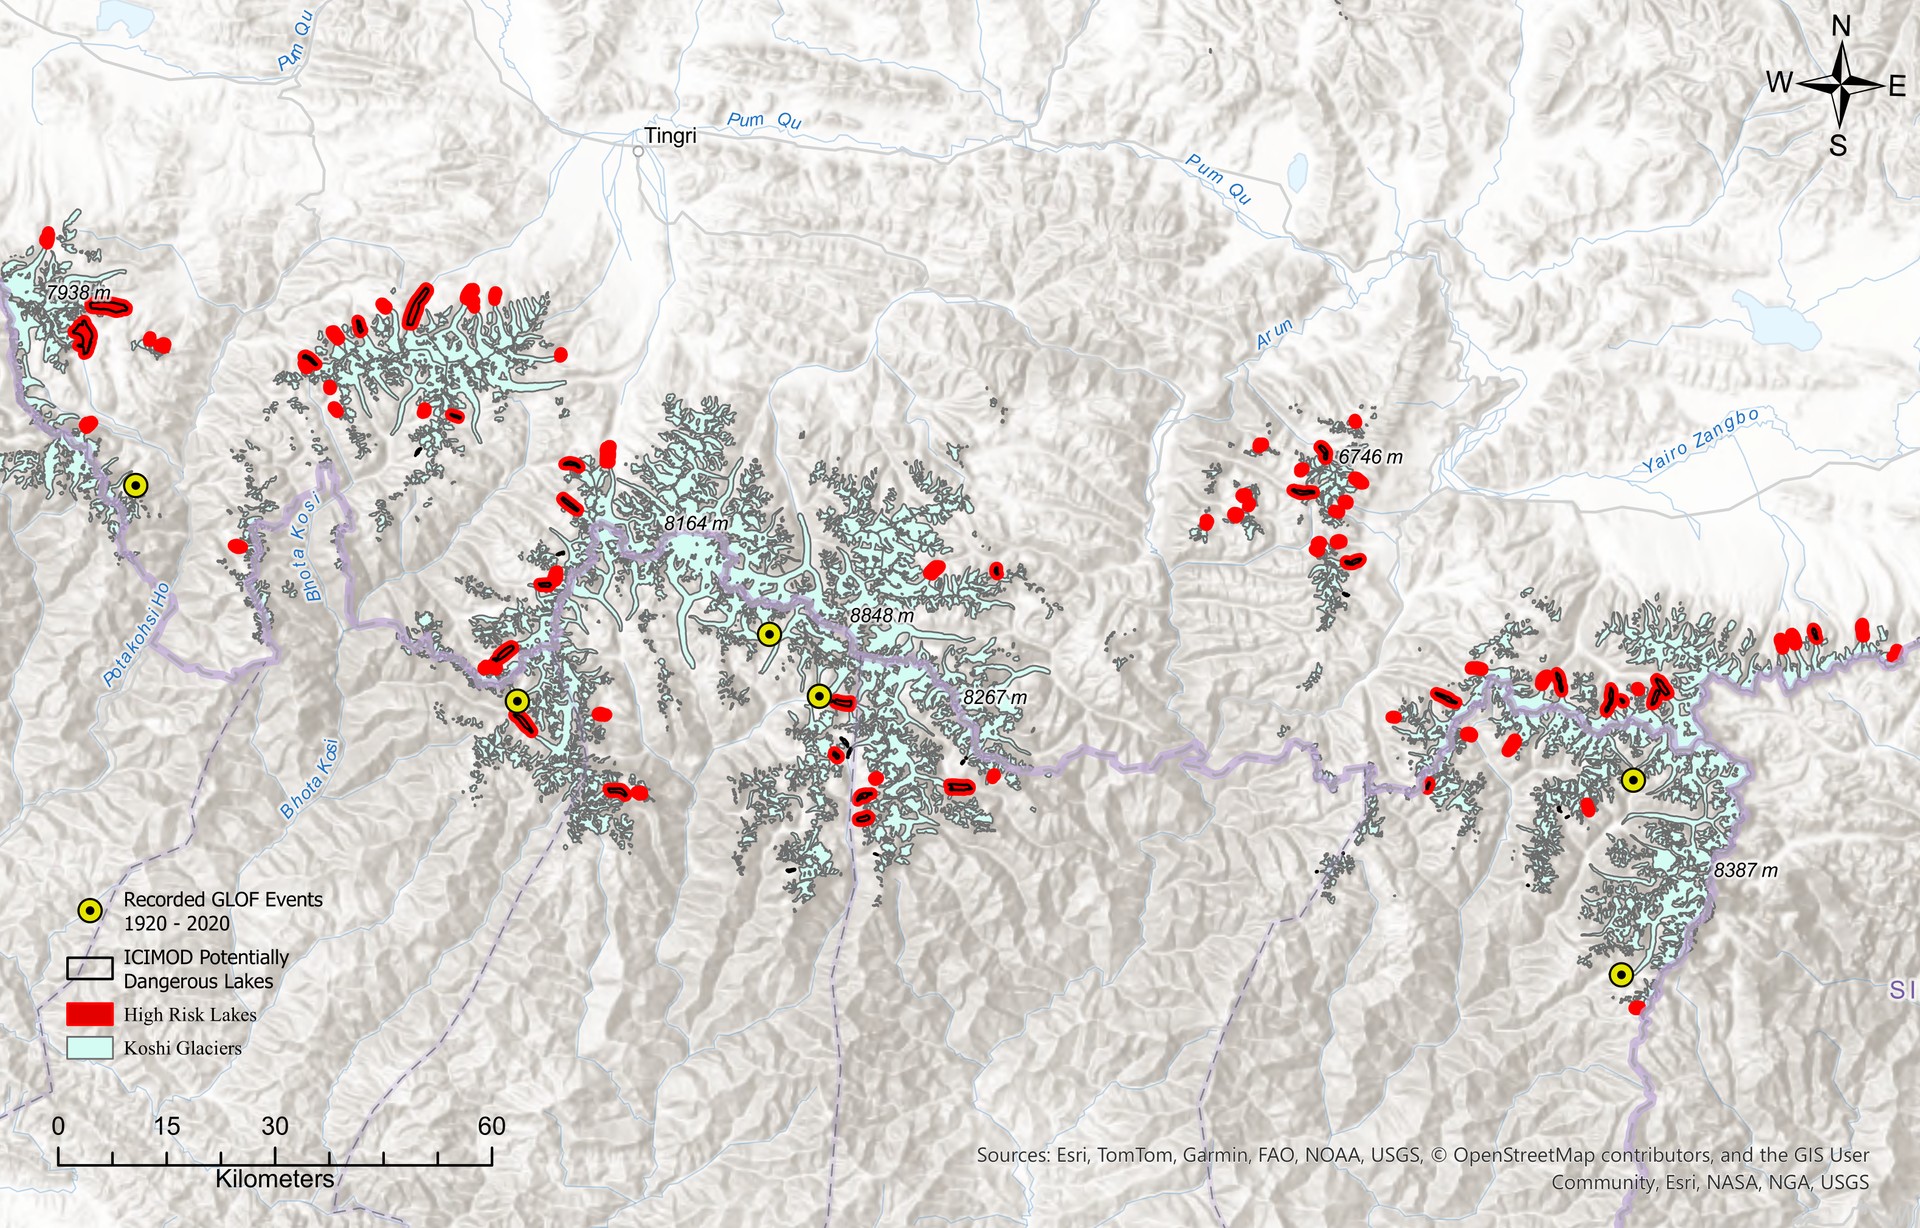
A screening model is only as trustworthy as its agreement with slower, field-based work. Validated against ICIMOD's authoritative inventory of 42 potentially dangerous glacial lakes, the three-factor model recovered 29 of them — including the two Rank-I benchmarks, Imja and Tsho Rolpa. For a method this lightweight, a 69% catch is a strong result, and the disagreements are useful in their own right: they mark exactly where rapid screening and detailed assessment diverge.
From hazard to people
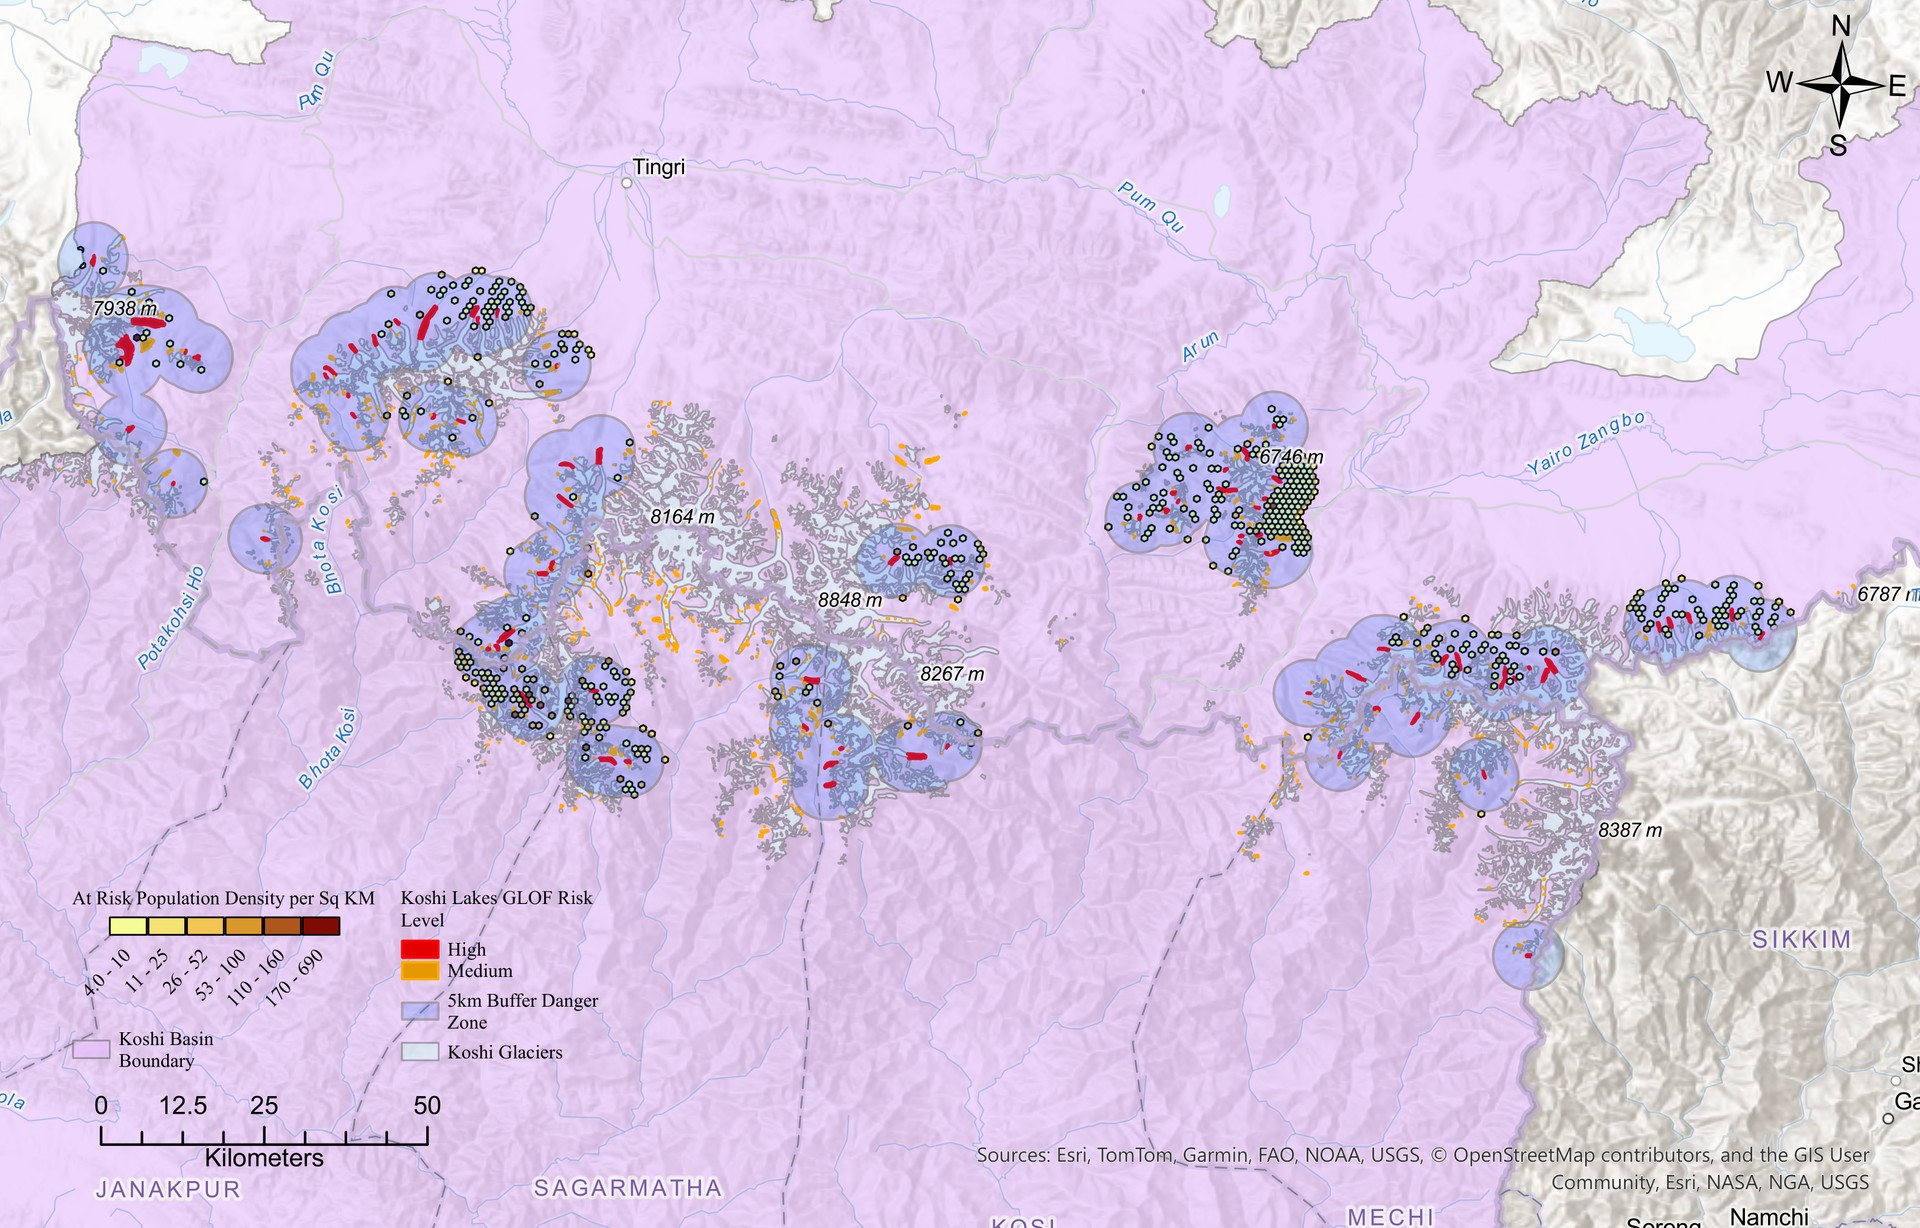
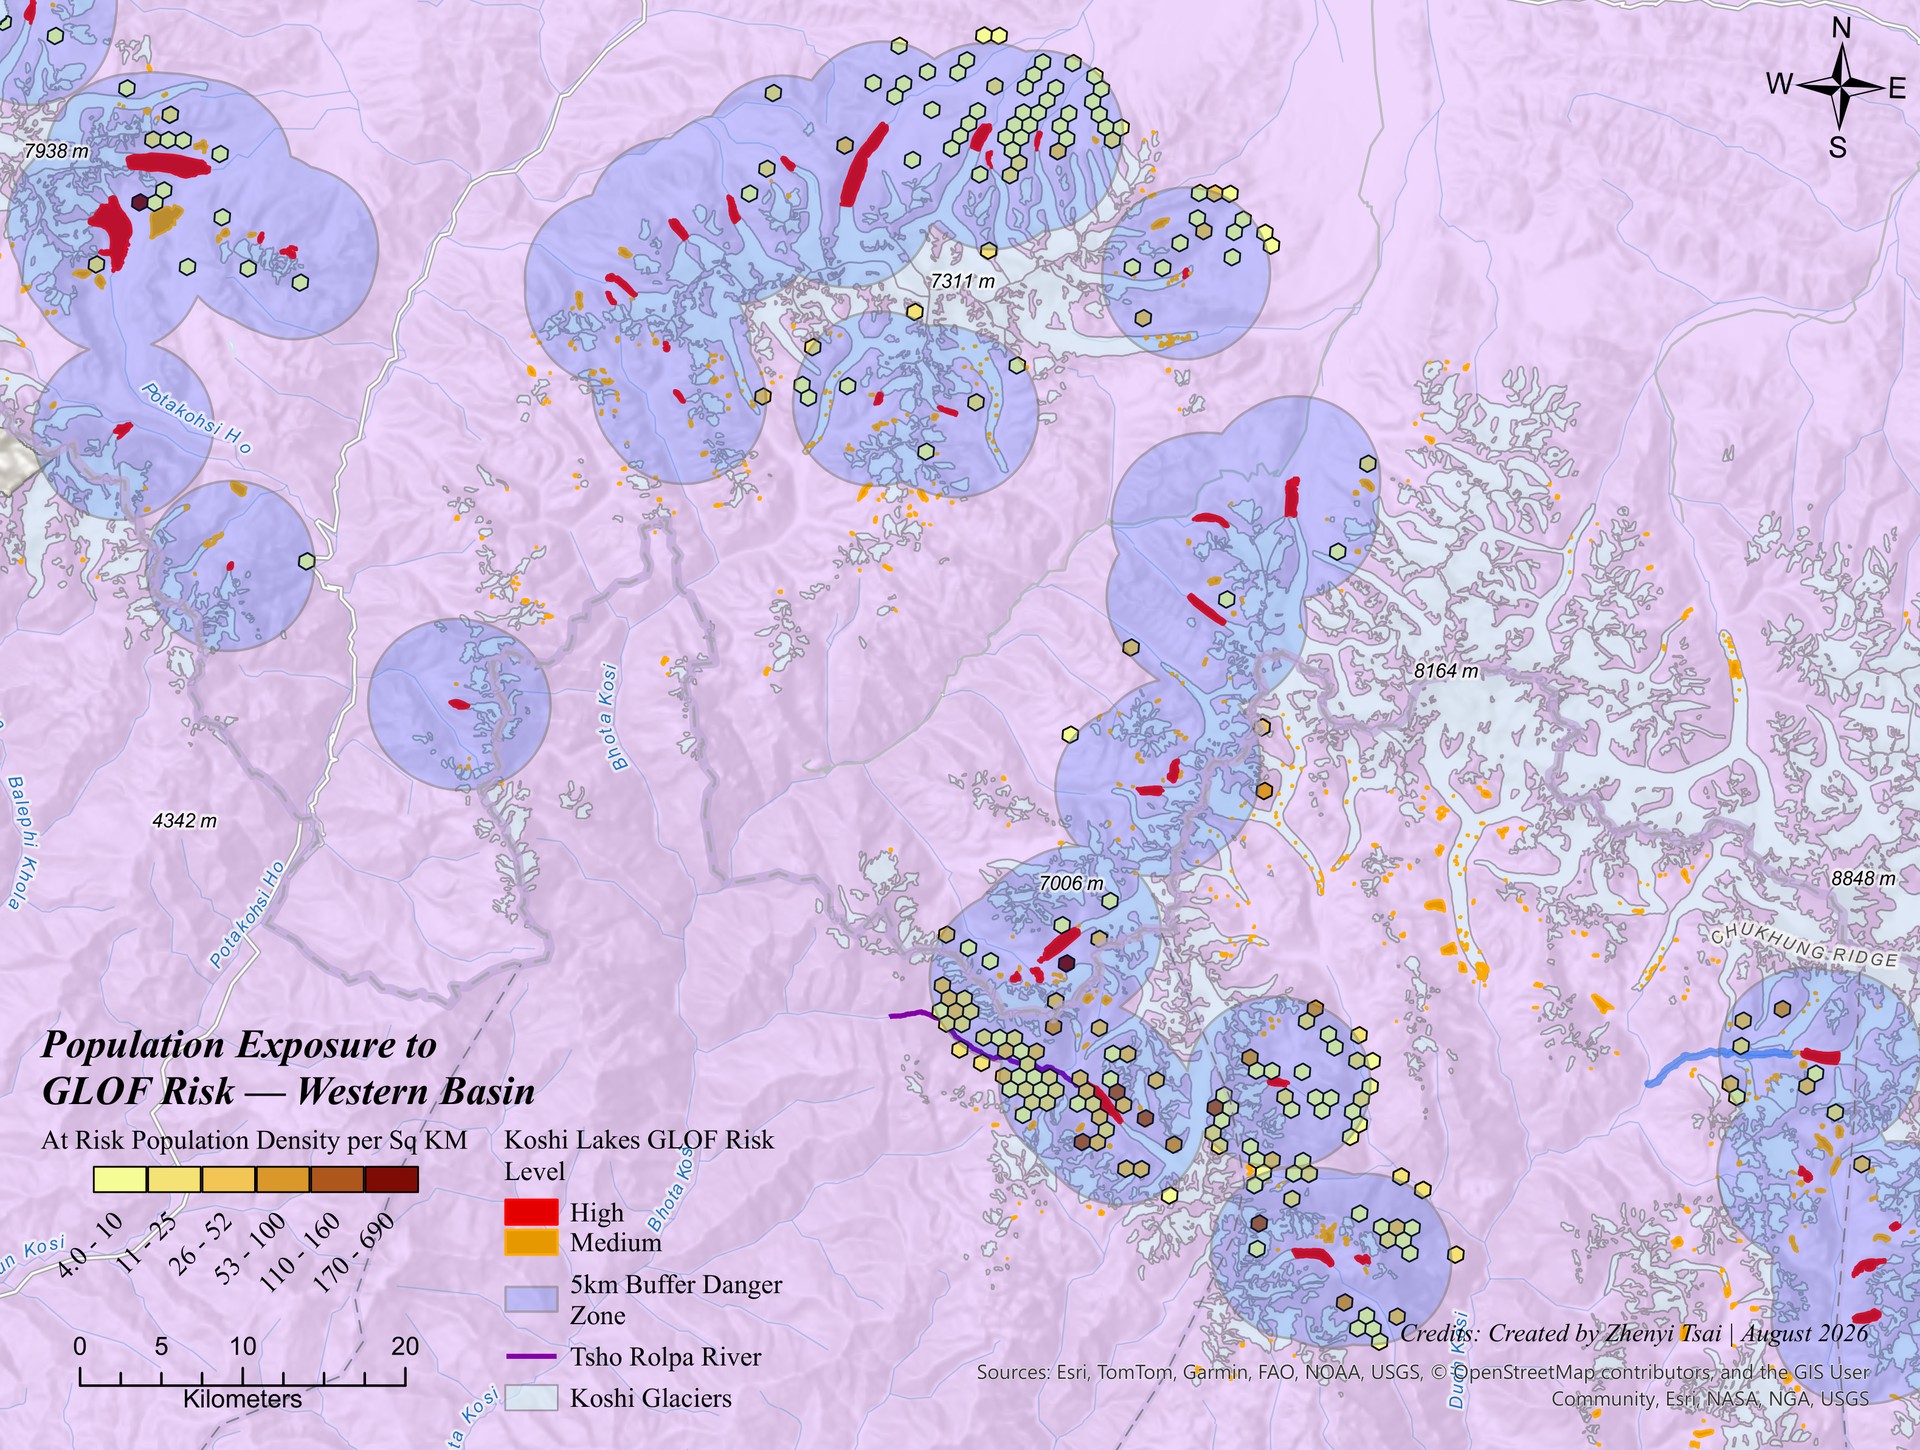
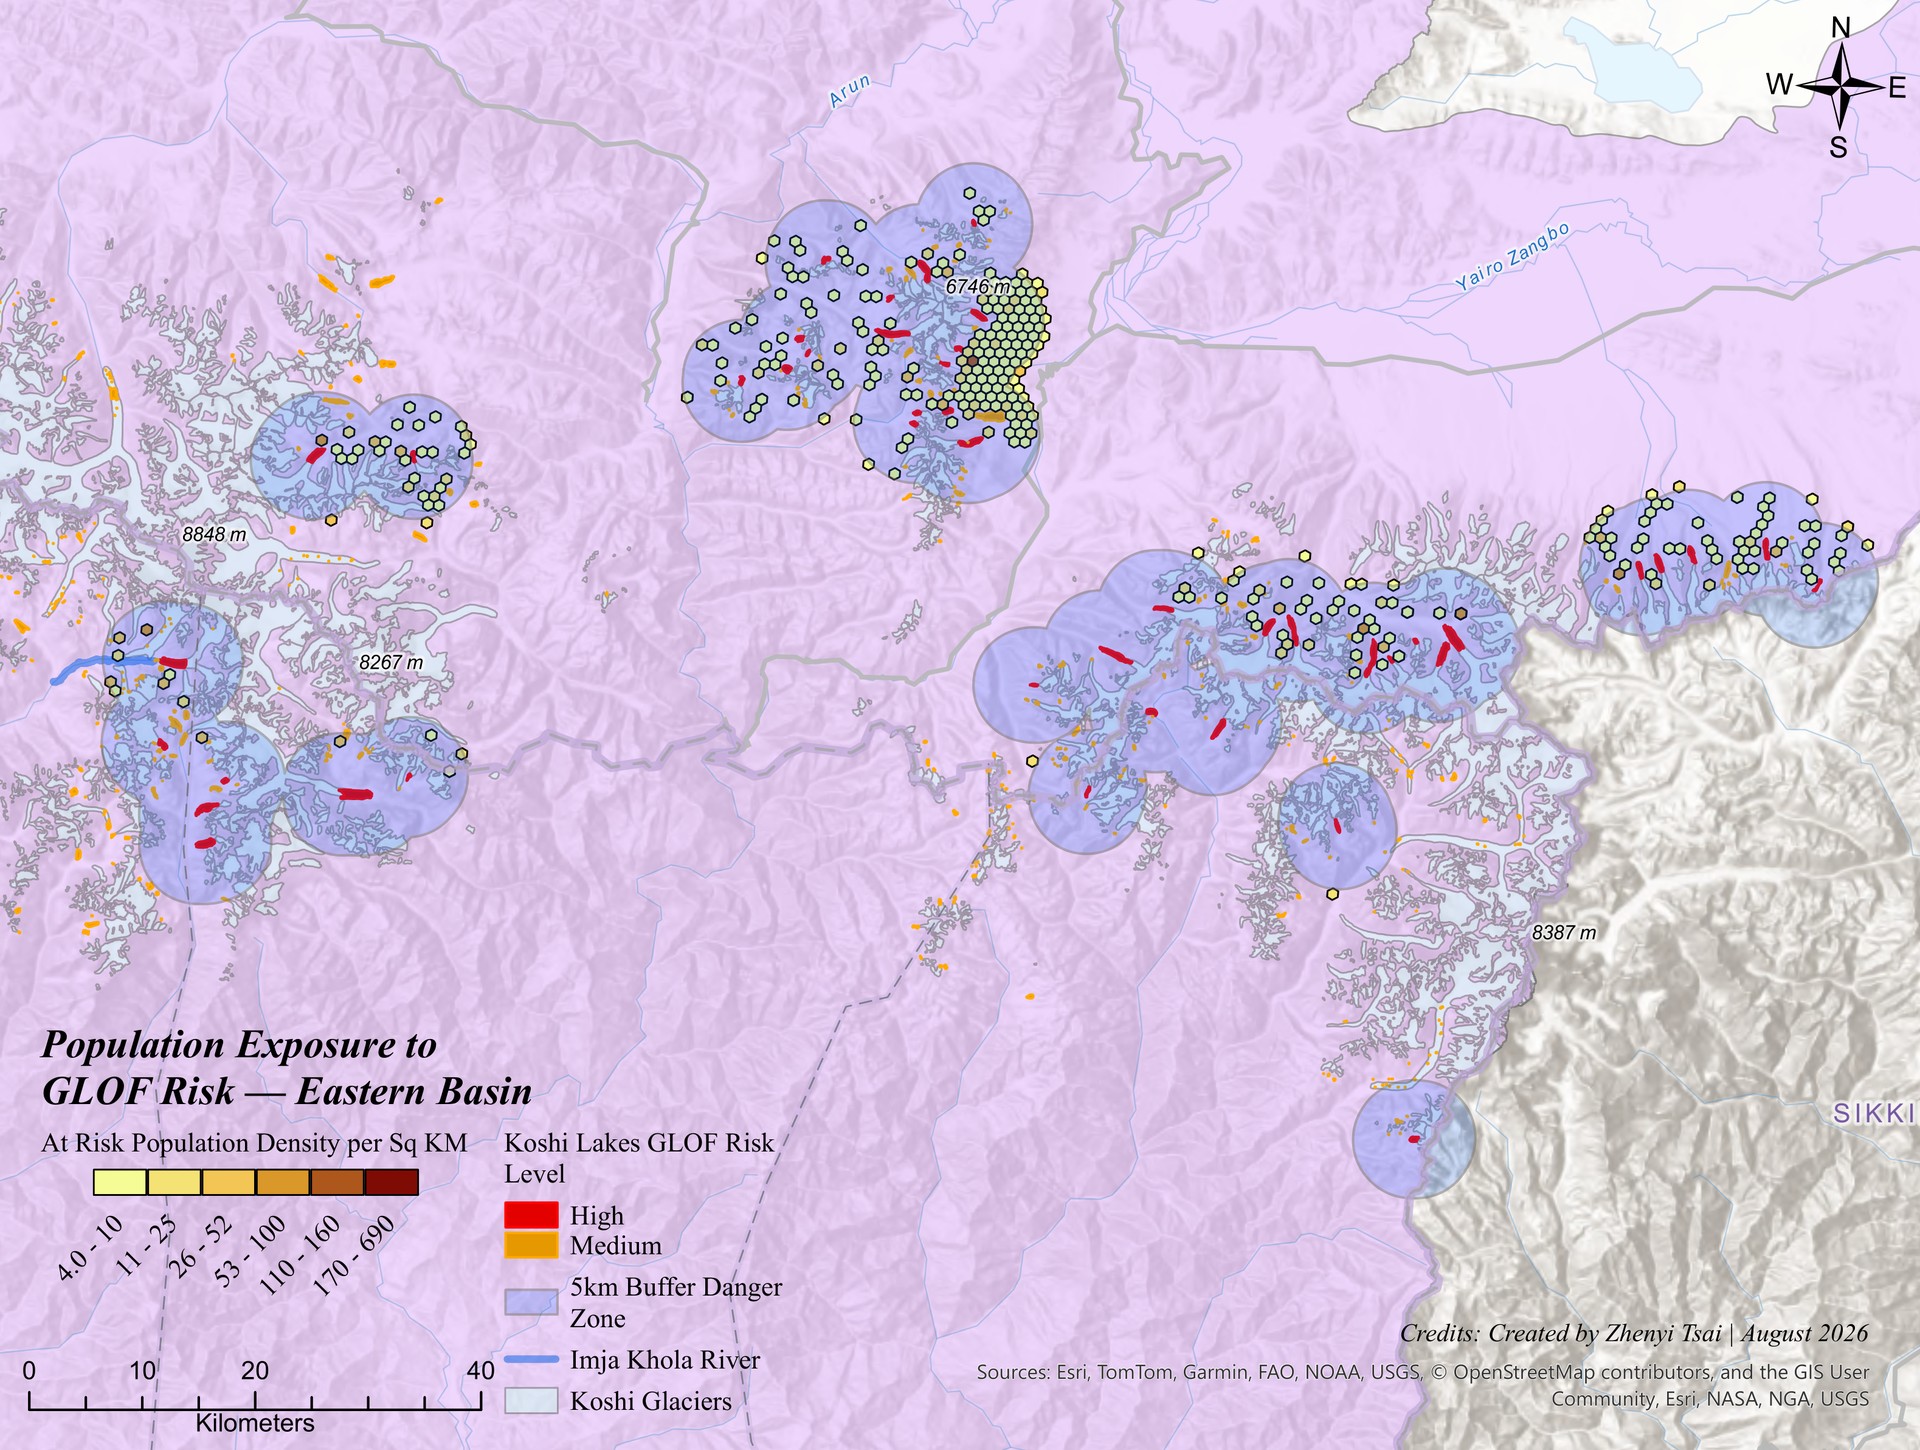
Risk is only meaningful once people enter the frame. Drawing a 5 km danger zone around the 79 high-risk lakes captures roughly 10,808 residents — a deliberately conservative baseline, since outburst floods travel far beyond five kilometres down-valley. Exposure concentrates in the thin, high-mountain valleys threaded between the glaciers.
The same hazard, two very different consequences
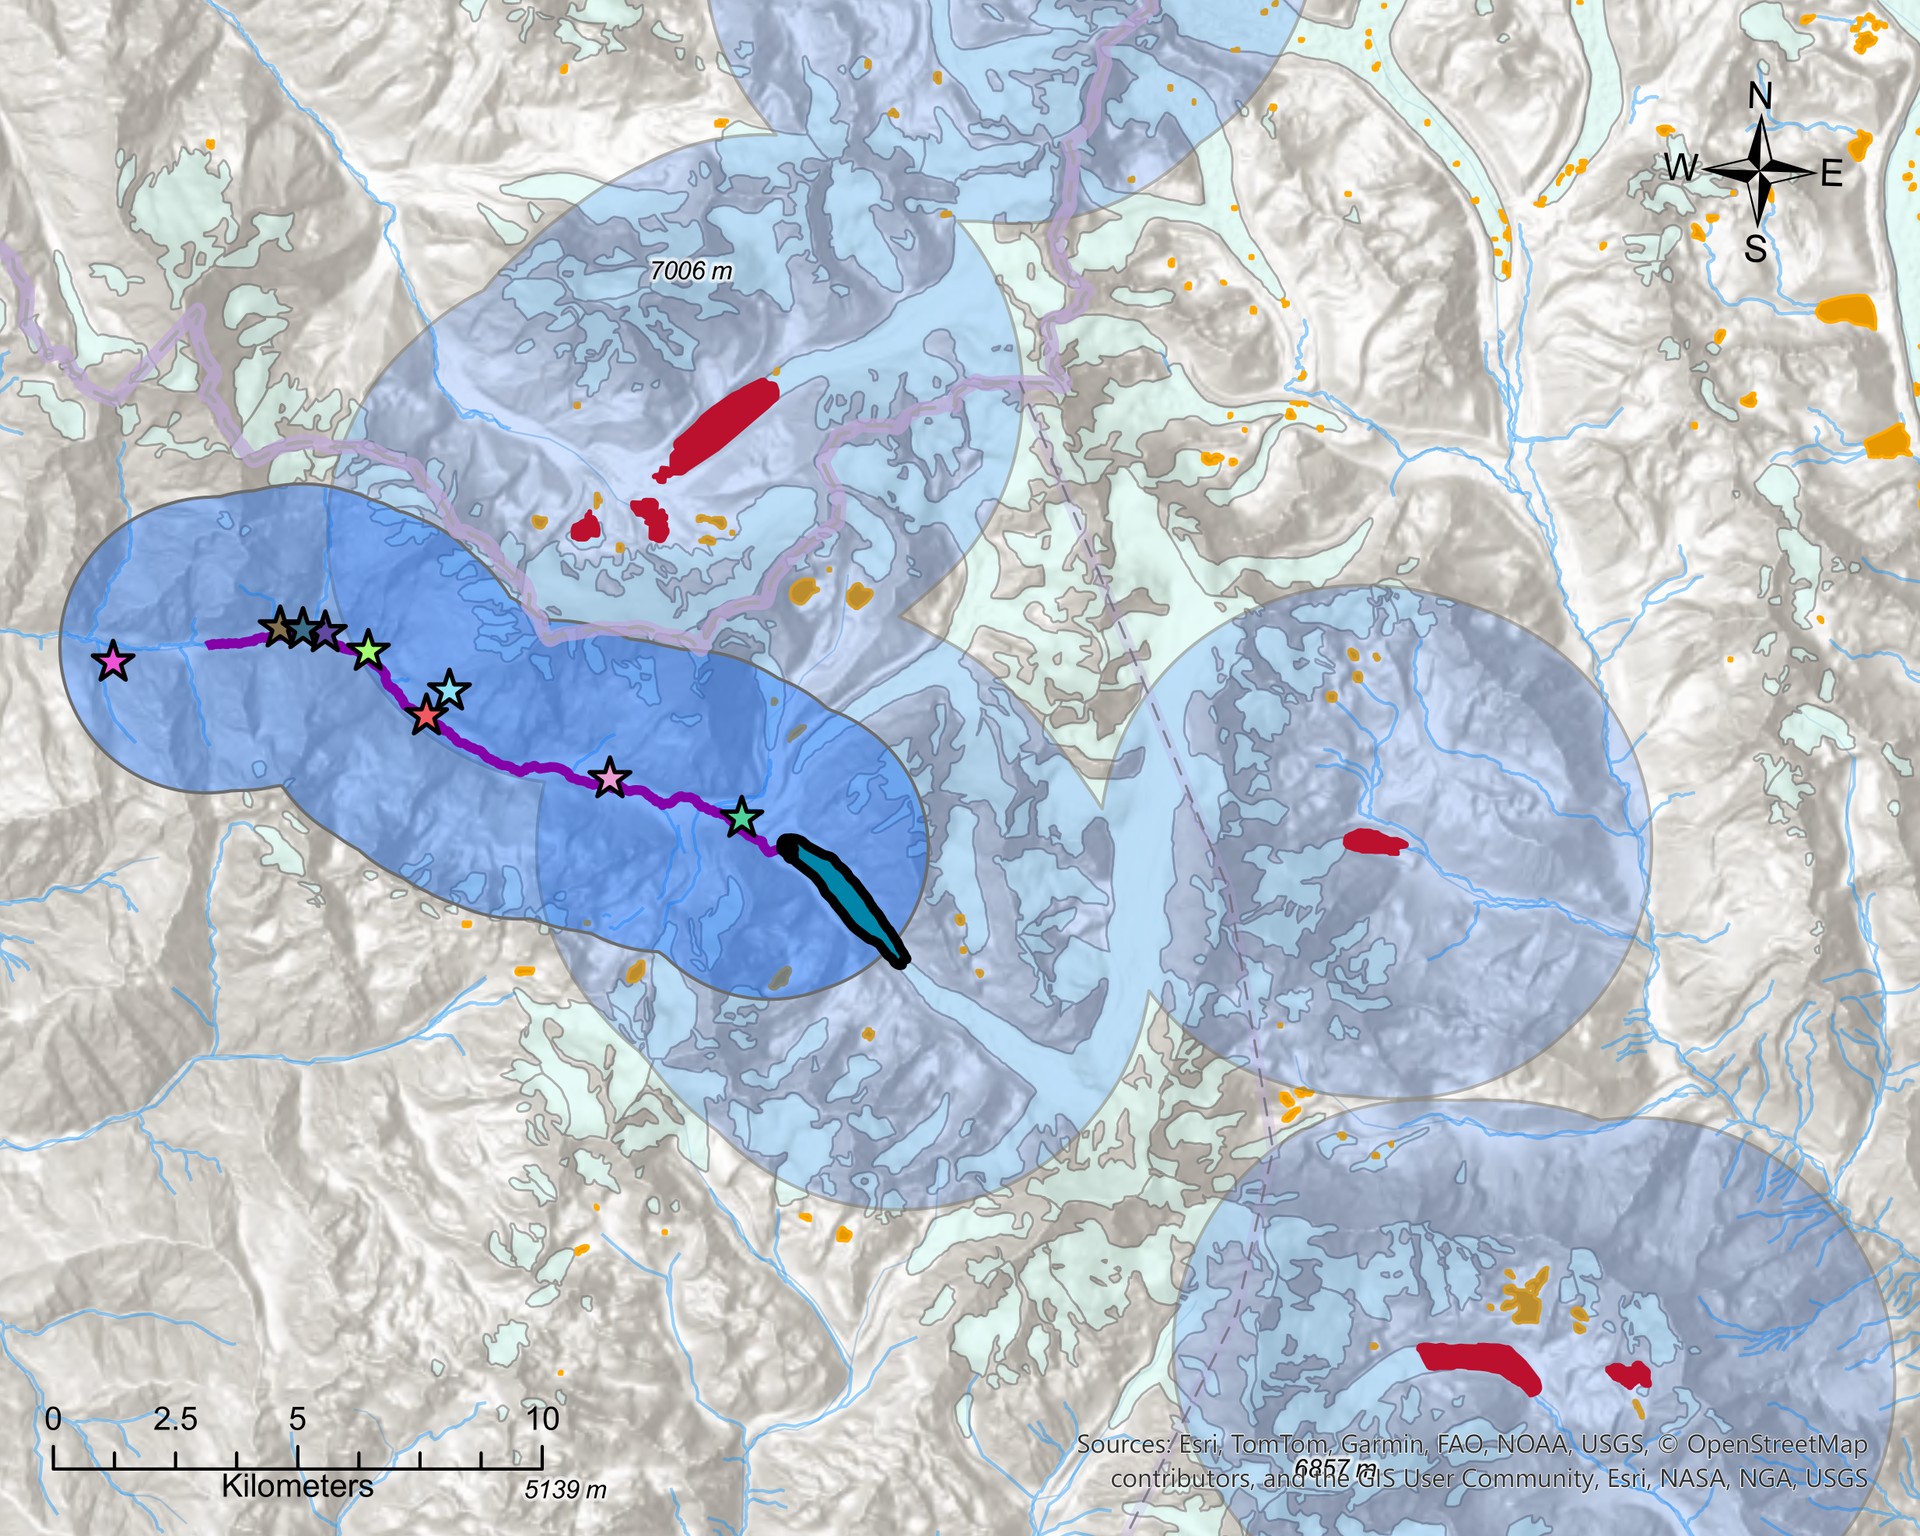
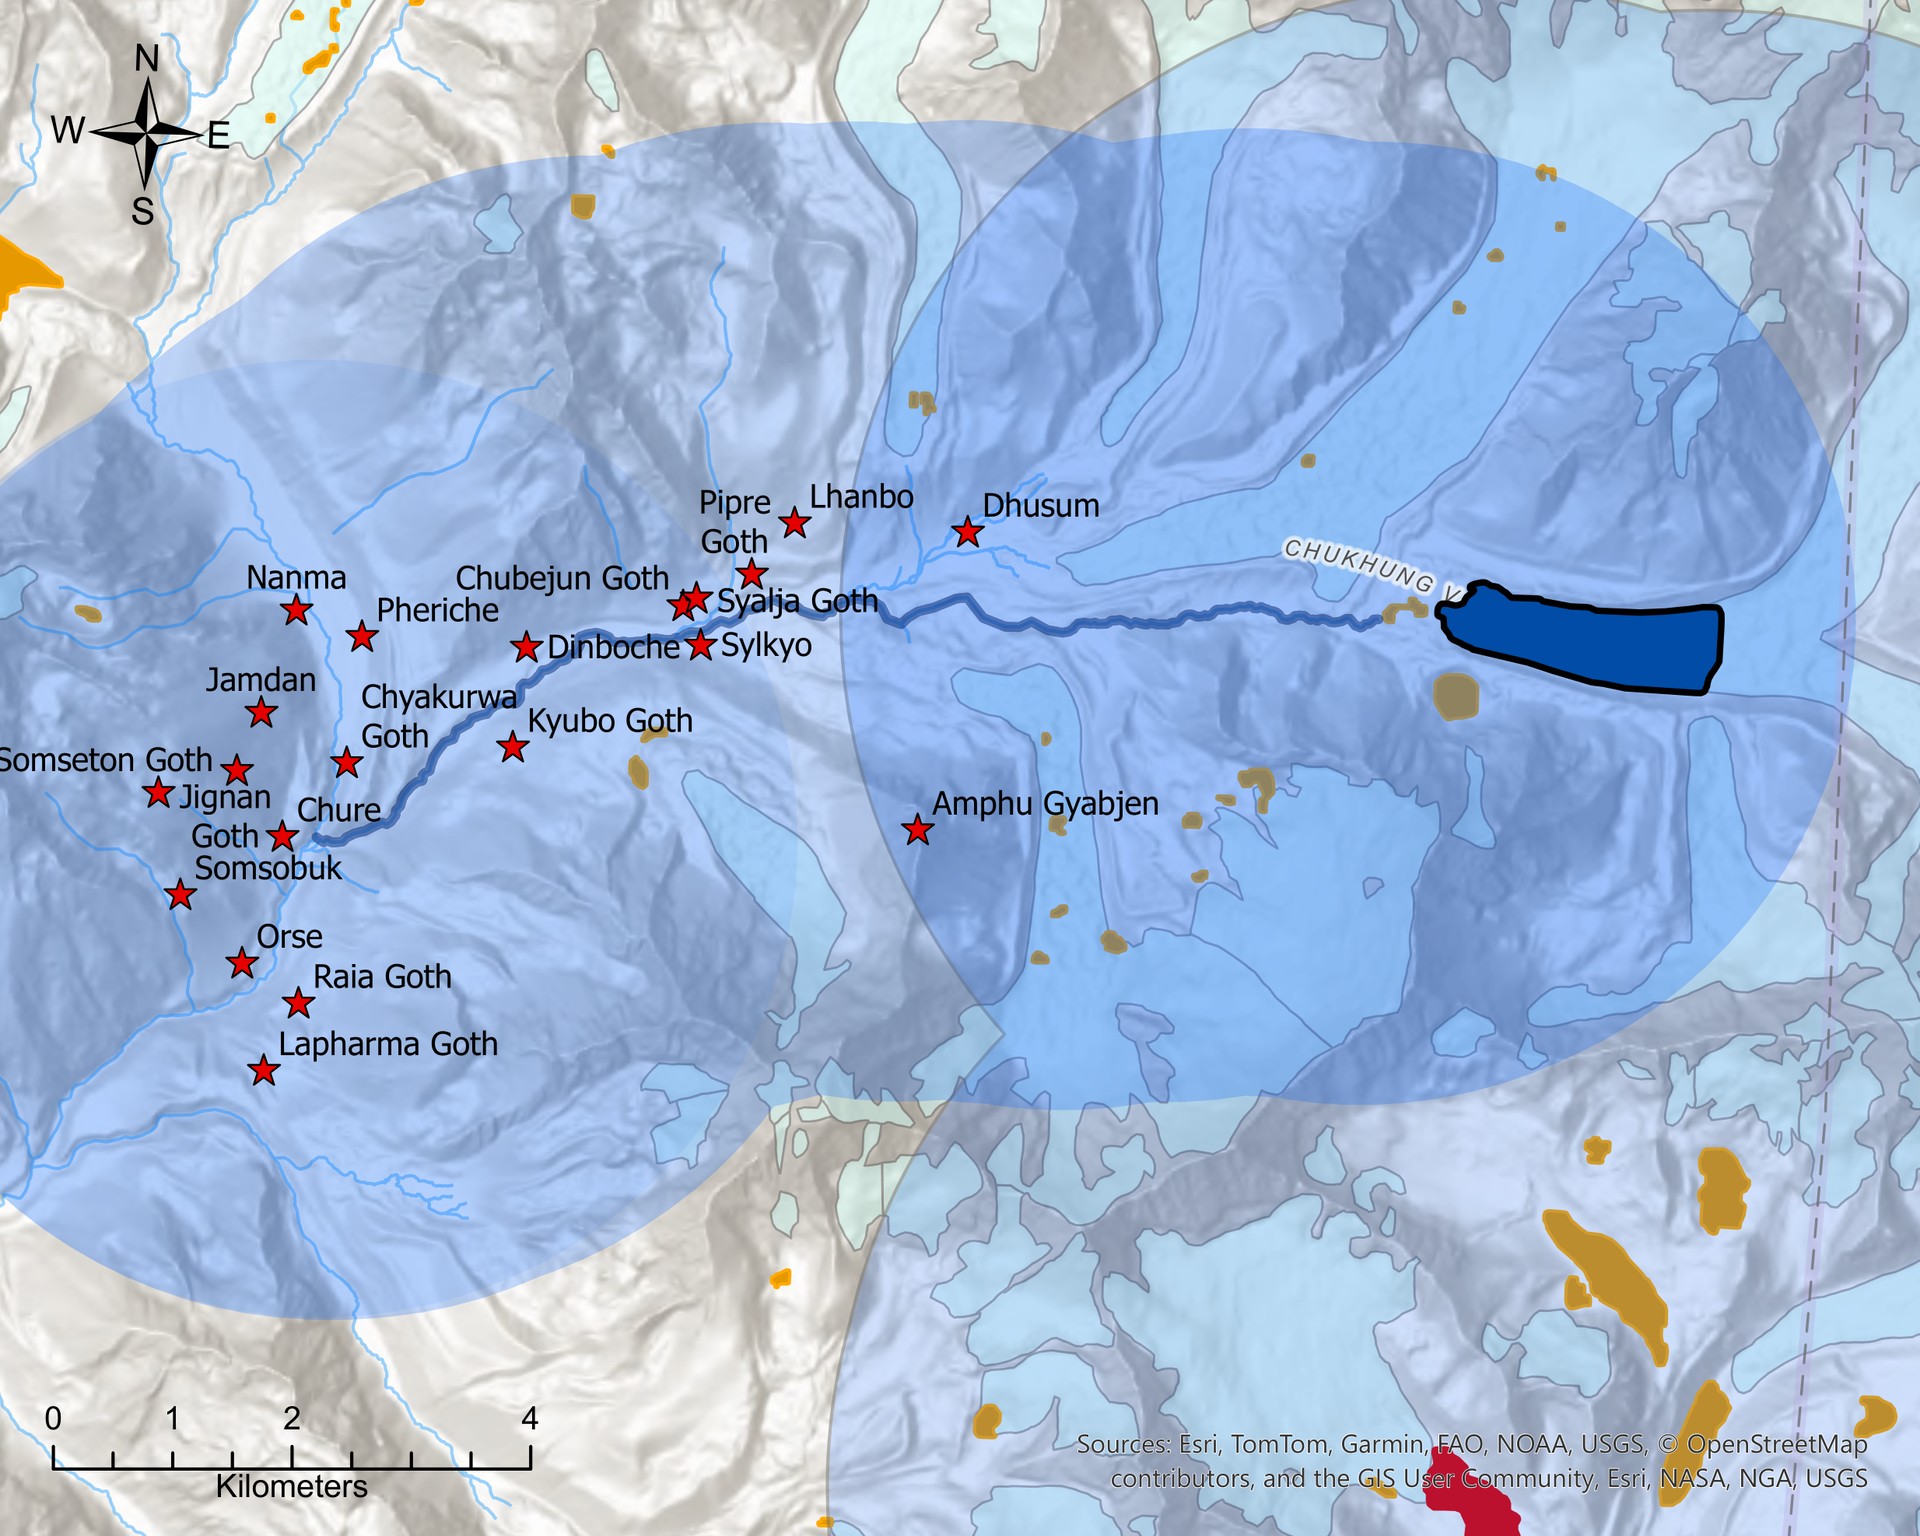
Proximity is a blunt instrument; a flood follows the valley, not a circle. Tracing the actual flow paths of the two marquee lakes turns the abstraction concrete — and reveals how much the downstream geography matters. Tsho Rolpa's corridor down the Rolwaling Khola threatens 9 settlements and about 1,134 residents. Imja's corridor crosses more villages — 20 — yet only ~224 modelled residents, because the upper Khumbu is sparsely and seasonally peopled.
Two Rank-I lakes, comparable hazards, and an order-of-magnitude gap in human consequence. That contrast is the argument for doing flow-path analysis at all.
Project 03 — Data engineering
NOAA Storm Events data pipeline
NOAA Storms
A small, one-command Bash pipeline that pulls a year of NOAA Storm Events data, converts it to GeoParquet, and lands it ready for DuckDB or QGIS. The whole pipeline runs in about 90 seconds.
The point was not just the storm data. It was getting comfortable with the modern geospatial stack — CLI, GDAL, GeoParquet, and GitHub — by using each piece in a practical workflow. The script finds NOAA's current publication of the selected year's details file, downloads and extracts it, creates point geometry from latitude and longitude, and writes a GeoParquet dataset in WGS 84.
The raw download and extracted CSV stay out of version control, while the processed output is ready to query in DuckDB, inspect in GeoPandas, or open directly in QGIS.
Repository structure
noaa-storms-pipeline/
├── pipeline.sh          # the main script
├── README.md            # what it does, how to run it
├── .gitignore           # excludes data/ from git
├── LICENSE              # MIT or similar
└── data/                # created by pipeline.sh, not committed
    ├── raw/             # downloaded .csv.gz files
    └── processed/       # converted .parquet files
Core conversion step · pipeline.sh
# Convert NOAA's CSV into GeoParquet with real geometry
ogr2ogr -f Parquet -overwrite \
  "data/processed/storms_${YEAR}.parquet" \
  "$CSV_FILE" \
  -oo X_POSSIBLE_NAMES=BEGIN_LON \
  -oo Y_POSSIBLE_NAMES=BEGIN_LAT \
  -oo KEEP_GEOM_COLUMNS=NO \
-a_srs EPSG:4326Selected academic writing
Writing on climate, energy, and the coast
Research and analytical writing on climate risk, environmental policy, energy, and impact assessment. Each opens as a PDF in a new tab.
A plain-language account of an open-data suitability model that rates 145 river reaches on head, drainage area, valley confinement, and settlement proximity, then tests its prediction against the approved Medog project. The interactive ArcGIS scene lets readers inspect the component and composite scores for each reach.
A screening-level hazard and exposure assessment using multi-criteria risk scoring, independent validation, population analysis, and downstream flood-corridor mapping across Nepal and China's Koshi Basin.
Weighing a proposed Salish Sea container terminal against salmon habitat, Southern Resident Killer Whale recovery, and Douglas Treaty fishing rights.
Tracking China's Nationally Determined Contributions against the Paris Agreement — and the just-transition and housing gaps that remain.
A case for decentralizing Canada's power grid and building out region-matched renewable generation, research, and manufacturing.
A Canadian-born Chinese Geographer whose work moves between the map and the field, usually high and cold.

We have failed to avoid crossing the 1.5°C global warming threshold, bringing consequential impacts that humanity has yet to fathom. Yet, confronted with this reality, I refuse to stand idle as our world, and all who inhabit it, face uncertainty and fear.
Although my broader research focuses on climate change, ecology, and environmental conservation, my recent work has examined how a warming climate reshapes mountain glaciers and who bears the consequences. Recent research has paired spatial analysis with time on the ground: surveying glacial lakes on the Tibetan Plateau one season, then turning that fieldwork into GIS models that provide agencies with detailed analysis and web programs for project planning or continued development.
In 2022, working with Tsinghua University's Institute of Climate Change & Sustainable Development, Zhenyi surveyed glacial lakes in Shannan Prefecture, assessing outburst-flood risk and tracing how climate-driven shifts in flow and sediment ripple through the basins that supply much of Asia's water, to support government infrastructural planning for major hydroelectric dams or other renewable energy sources, while working alongside Tibetan communities to fold local ecological knowledge into infrastructure development. That work has paid off, as construction of the Medong River dam has begun.
The following year brought a different kind of problem. As an agroecology coordinator for the Qilian County government in Qinghai, I used my knowledge of soil chemistry and permaculture to facilitate rebuilding thin highland soil into workable loam, design drip irrigation for a water-scarce valley, and stand up the region's first biogas digester to turn organic waste into household fuel. Between the two, sits a consistent interest in the practical, resilient work of sustainable development.
Back in Vancouver, that focus shows up as teaching and organizing: building climate-justice curriculum as a UBC teaching assistant, translating climate-wellbeing research into classroom tools, and — separately — certifying the next set of first responders as a Red Cross first-aid instructor. Two degrees underpin it: a BA in Geography & Environmental Science from UBC and earlier study in Political Science & Environmental Studies at the University of Toronto.
Head coach of UBC Muay Thai and past president of the UBC Buddhist Student Association — the discipline-and-stillness end of an otherwise field-heavy life.
Certified Emergency Medical Responder and Wilderness First Responder — useful credentials when your study sites are days from a road.
Works in English, Tibetan and Mandarin, which made the Qinghai and Tibet fieldwork possible in the first place. I am also currently learning French for work in Canada and Africa.
Résumé
Download PDFEducation
University of British Columbia
2022 – 2026BA, Geography & Environmental Science · Vancouver, B.C.
- Focused on climate systems, remote sensing, spatial analysis, environmental policy, and community-based adaptation.
University of Toronto
2020 – 2022Political Science & Environmental Studies · Toronto, Ontario
- Built a foundation in environmental governance, policy analysis, and applied social science for climate resilience.
Research & field experience
Field Research Assistant
Apr – Sep 2024Tsinghua University, Institute of Climate Change & Sustainable Development · Shannan Prefecture, Tibet Autonomous Region
- Surveyed glacial lakes on the Tibetan Plateau to assess outburst-flood risk and identify climate-related hazards facing mountain communities.
- Integrated geospatial analysis with field observations to evaluate hydrological and sediment dynamics across glacier-fed river basins.
- Worked alongside Tibetan communities to incorporate local ecological knowledge into risk assessment and development planning.
Agroecology & Permaculture Coordinator
Mar – Nov 2025Qilian County Government, Agricultural Department · Qinghai, China
- Supported five Tibetan families transitioning from nomadic pastoralism to settled agricultural systems in a water-scarce highland context.
- Designed regenerative soil systems, drip irrigation strategies, and integrated crop-livestock planning to improve resilience and productivity.
- Led the installation of a biogas digester to convert organic waste into renewable household fuel and improve local resource circularity.
Teaching & applied practice
Teaching Assistant, Geography
May 2023 – May 2024University of British Columbia · Vancouver, B.C.
- Delivered curriculum and tutorial support for climate justice, carbon accounting, and environmental systems analysis.
Climate Wellbeing Coordinator
Sep 2025 – May 2026UBC Sustainability Hub · Vancouver, B.C.
- Developed teaching resources connecting climate research to wellbeing, adaptation, and classroom-based engagement.
First Aid Instructor
May 2024 – PresentCanadian Red Cross / Pacific First Aid · Vancouver, B.C.
- Certified and trained community members in Standard First Aid, CPR, and wilderness emergency response.
Leadership & advocacy
Student Sustainability Council
2022 – 2025University of British Columbia · Vancouver, B.C.
- Advanced campus sustainability initiatives and climate action planning across student and university networks.
Head Coach
2023 – PresentUBC Muay Thai · Vancouver, B.C.
- Coach student-athletes while maintaining a disciplined, community-centered training environment.
Past President
2022 – 2023UBC Buddhist Student Association · Vancouver, B.C.
- Facilitated community programming and supported student wellbeing, cultural engagement, and leadership development.
Current climate research
Research focus
2025 – PresentClimate risk, mountain hydrology, and environmental adaptation
- Examining glacial lake outburst flood risk, downstream exposure, and climate-driven changes in mountain hydrology across the Himalaya.
- Integrating remote sensing, GIS, and field observations to evaluate how glacier retreat, hydrological shifts, and infrastructure planning interact in high-elevation systems.
- Applying spatial analysis to climate adaptation, environmental justice, and the social dimensions of climate resilience in vulnerable communities.
Skills
Let's find the water together
Open to research, GIS, and climate-risk work — and always up for a conversation about mountains, mapping, or fieldwork somewhere far from a road.